XRT/3d: インタラクティブな3D グラフウィジェット
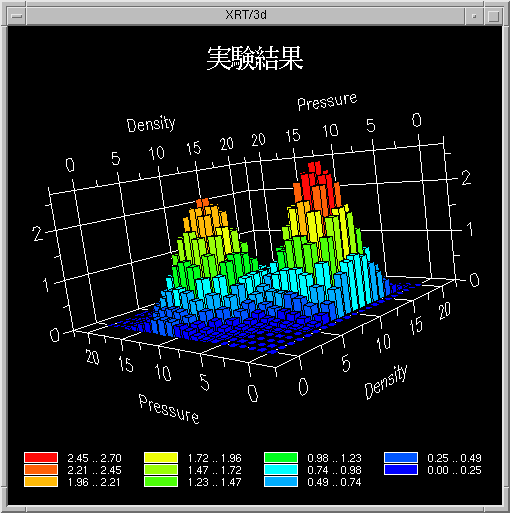
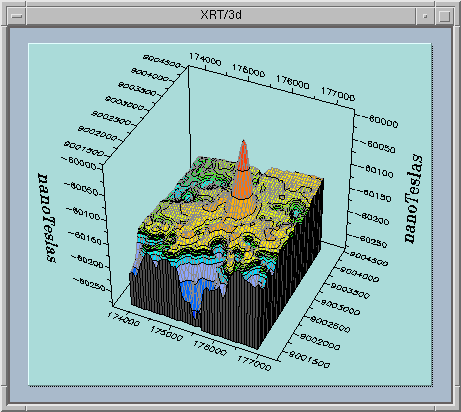
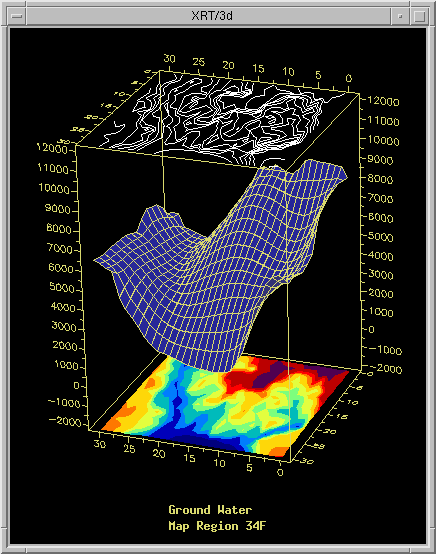
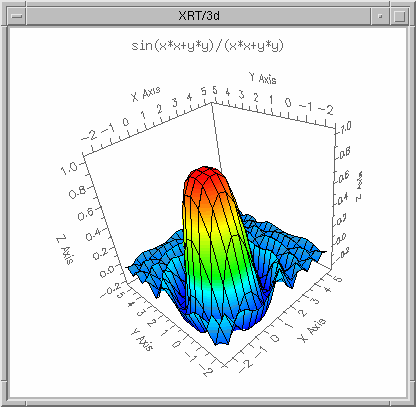
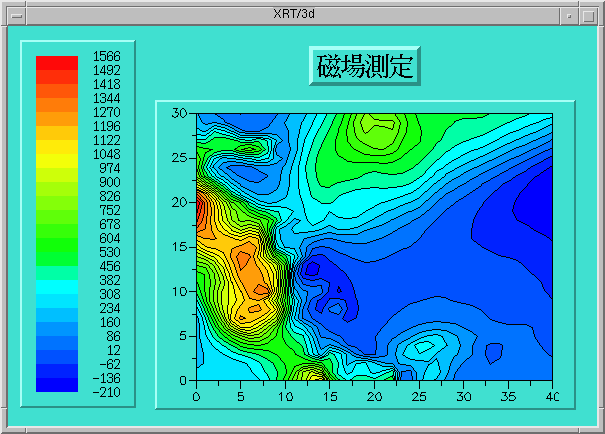
XRT/graph は、棒グラフ、X-Y プロット、円グラフ、面グラフ等の基本的な 2D グラフを始め、ビジネス、統計、科学技術等、幅広い分野のグラフが作成できるパワフルな Motif ウィジェットです。 グラフの表示や動作は、200以上のリソ-スを用いて簡単にコントロ-ルすることができます。
グラフのデ-タ
あらゆるソ-スのデ-タのグラフ化が可能で、デ-タはいつでもアップデ-トできます。但し、X-Yのグリッド形式に従ったZ値が必要です。 デ-タの欠損値"hole"も処理できます。Cのデ-タ構造体を割り当てたり、ファイルからデ-タを読み込む関数も提供されています。
グラフの種類
DrawMesh、DrawShaded、DrawContours、DrawZones の四つのリソ-スを組み合わせて15のサ-フェス/等高線グラフと15の棒グラフ/ヒストグラムが作成できます。 隠線の消去や透視図法のリソ-ス等も提供されていますので、洗練されたグラフが作成できます。 デ-タの範囲をビジュアル化する等高線やゾ-ンの色付けは自動的に行われ、リニアまたは、ユ-ザが指定した分布表が使用されます。 3Dメッシュまたは3D棒グラフにデ-タセットを重ねて4Dグラフを作成できます。(4番目の次元は色で表されます。)
グラフの構成
軸
軸の注釈はデ-タから自動的に計算されます。 X軸、Y軸、Z軸の最小値、最大値、テキストラベルや軸のタイトルは任意に指定できます。
ヘッダ-とフッタ-
複数行のヘッダ-とフッタ-のテキストを左、右、中央揃えに設定できます。テキストはデフォルトで最適の位置に配置されます。
テキスト・オブジェクト
デ-タの特定なポイントにコメントを表示したり、ユ-ザがマウスで選択したポイントに対してダイナミックに注釈などを追加することができます。 このテキスト・オブジェクトは、標準の Xt( )ル-チンを使用して作成、操作でき、サ-フェス上のグリッド・インデックスや、デ-タポイント、特定のピクセルに貼り付けることができます。
凡例
グラフが等高線やゾ-ンを表示する時、凡例は自動的に作成されます。 凡例は水平または垂直に表示でき、アンカ-を使用して位置を決めることができます。
ユ-ザ・インタラクション
ズ-ム、スケ-リング、移動、回転
マウスを使用して、エンドユ-ザは 3D グラフを自由に回転、スケ-リング、ズ-ムでき、デ-タを様々な角度から検証することができます。 指定した軸に沿った回転や、マウスで描いたズ-ムボックスの範囲だけのズ-ム、回転中のグラフの表示・非表示等、あらゆるユ-ザの要求に応えます。 このインタラクティブ回転機能はウィジェットに組み込まれ、プログラマまたはエンドユ-ザ自身によってカスタマイズできます。
ユ-ザ・フィ-ドバック
フィ-ドバック・ル-チンを利用して、簡単にアプリケ-ションにユ-ザ・フィ-ドバック機能を提供できます。 ユ-ザがグラフのある点をクリックすると、プログラムはその点の値をユ-ザに返し、その点を新しい値へドラッグすることができます。 map( )はマウスイベントをグラフ座標に対応させ、pick( )はどのデ-タがマウスイベントに一番近くに位置するかを決定します。
その他の機能
- ダブル・バッファリング
- 大きなデ-タセットから適正なサイズのデ-タセットを作成するル-チン(ソ-スコ-ド)
- ユニット・キュ-ブ(軸を含む 3D グラフ全体を囲む最小単位のキュ-ブ)の上部と下部に表示される等高線やゾ-ンのプロジェクション(投影)
- リソ-ス逆変換プログラム
XRT/3d のリソ-ス - The Power of Object-Oriented Resources
DrawMesh、DrawShaded、DrawContours、DrawZones の四つの Boolean リソ-スを使用して、基本的なサ-フェス、等高線図、棒グラフ等の様々なグラフが表示できます。 XRT/3d には140個のリソ-スが提供されていますが、ほとんどのグラフでは、デフォルトで適した値が選択されますので20以下のリソ-スを設定するだけで充分です。 オブジェクト指向リソ-ス・プログラミングにより、開発者だけではなくエンドユ-ザもいつでもグラフの設定を変更することができます。
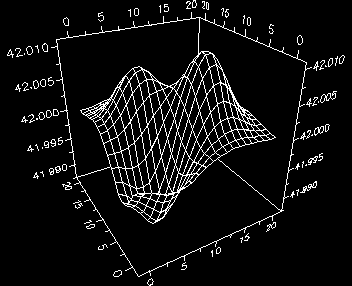
始めに、XRT/3d にデ-タセットを渡します。 デフォルトでは、DrawMeshはon、DrawShaded、DrawContours、DrawZones は off になっています。
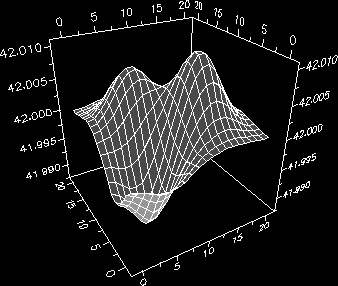
次に DrawShaded を on にします。また、サ-フェスの上部と下部の色もセットします。
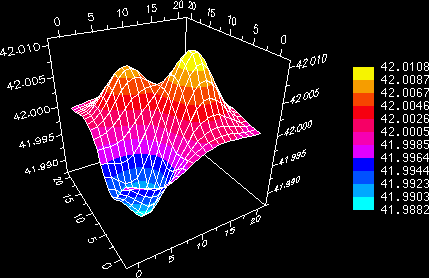
DrawZones が on になると、デ-タは分布表に基づいて(デフォルトでは10個の)ゾ-ンにグル-プ化されます。 各レベルの注釈を示す凡例がグラフの横に表示されます。
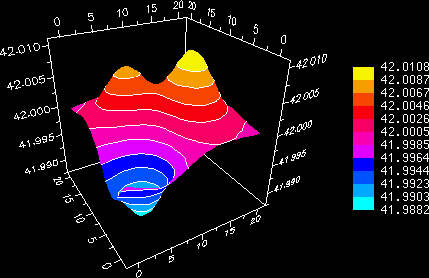
DrawMesh を off、DrawContours を on にすると、ゾ-ンと等高線だけが表示されます。
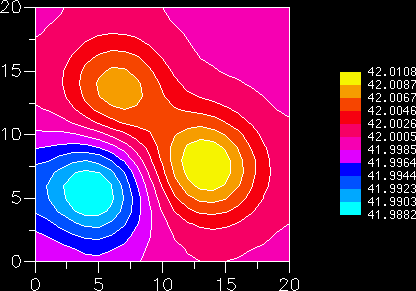
2Dでこのサ-フェスを見るには、DrawShaded を off にします。
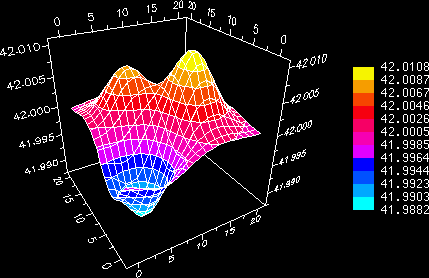
DrawMesh と DrawShaded を on に戻すと、ゾ-ン、グリッド、等高線が3D グラフに表示されます。
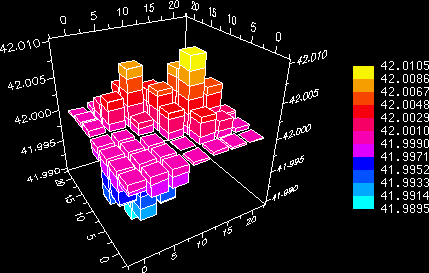
XRT/3d から提供されているサンプリングのル-チンを利用してデ-タの量を減らし、グラフの Type を Bar に変更して、このデ-タを今度は 3D 棒グラフに表示します。 各棒には、ゾ-ンと等高線がまだ表示されています。
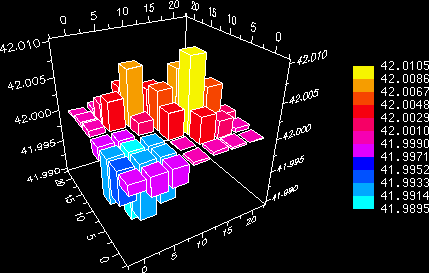
最後のグラフは、ゾ-ン値に対応するよう各棒が一色で表示されています。 これらの例で使用したリソ-スの他に、XRT/3d には、その他100以上のリソ-スがあります。
XRT/3d ではあらゆる種類のグラフを作成することができます。ここをクリックすれば、その他のグラフの例を見ることができます。